|
|
 |
|
|
|

INTEX-A
|
ICARTT Data Management Implementation Plan
Eric Williams; AL/NOAA
Jim Crawford; LaRC/NASA
Ali Aknan; LaRC/NASA
Hans Schlager; DLR
(1 December 2004)
|

INTEX-B |
|
|
Part I. Overview of ICARTT Data Management
- 2004
1. Introduction
The ICARTT study will involve a large number of measurement
platforms that will provide a tremendous volume of data. Because there are
a number of laboratories involved in the study, each with their own way of
handling data, common methods of dealing with data must be identified and
agreed upon prior to the study. This will facilitate data transfer both during
the study and, more importantly, after the campaign is completed. Toward
this end a data transfer and archiving standard has been agreed to by all
of the principals in the study. This standard, modelled after the NASA Ames
format, has been chosen because it is quasi-universal (i.e., most institutions
are familiar with it), it satisfies most of the data handling issues that
are expected to arise during this study, and it is easily handled by most
computer-based data manipulation programs especially those used for merging
and archiving data for public use. For reference, the full specification
for the Ames file exchange format can be found at: http://cloud1.arc.nasa.gov/solve/archiv/archive.tutorial.html.
The Ames data format describes a generalized procedure by which
data are placed into structured files with accompanying header information
and appropriate file names. Since the ICARTT data format will vary somewhat
from the Ames format, the purpose of this document is to specify in detail
the exact structure for ICARTT data files, the exact information and structure
of the header, and the exact file names to be used. The reasoning behind
these specifications will become apparent as the details emerge below.
We first discuss the overall strategy and considerations for data management
followed by a detailed description of the format requirements for data files
during and after the ICARTT study.
2. Data exchange protocol
A. Data Managers
Certainly many issues and problems will arise with a study
of this size and will need to be addressed. Toward this end, we recommend
that each group designate a Data Manager (DM) who will be responsible for
ensuring that all the measurements from that group be placed on an accessible
server in the required format and within the timeframe specified below. These
people should be identified well before the study so that all Data Managers
can collectively address the needs and requirements for data exchange and
identify and implement solutions prior to the start of the field campaign.
It is the team of Data Managers, with some input from the Data Management
Working Group, that will make the decisions regarding all aspects of ICARTT
data exchange.
B. Data access
There will not be a central data collection and distribution
server, but rather individual data servers set-up and maintained by each
group and accessed either via the web or ftp. Collectively, these sites can
be thought of as a data repository (see Figure 1).
We should ensure that all groups involved in the study have a server that
is accessible. If not, arrangements should be made for the data from that
group (or PI) to be placed on the server of one of the other groups in the
study. All participants will have access to all the data products available
during and after the study.
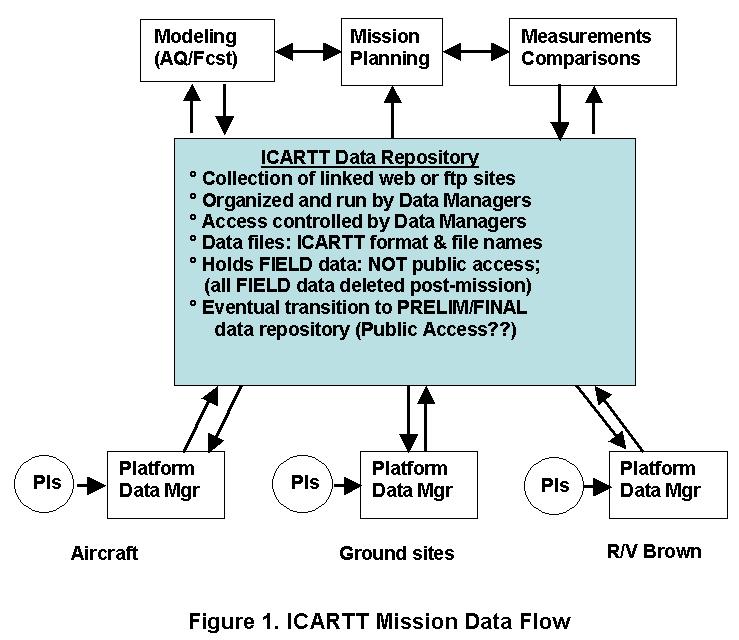
C. Data transfer during the field study
During the field study every attempt should be made to have
data posted to the data repository no more than 24 hours after the measurements
have been taken. For some data this will be an absolute requirement due to
the needs of flight and ship track planning. These data should be identified
well before the commencement of the field campaign.
During and immediately after the campaign, “field” data files will be available.
Data exchanged during the field study are considered a special case since
these data are typically “first look” and, due to time constraints, are not
likely to have undergone the full scrutiny of the PI. In order to reflect
this fact the file names will be modified slightly with respect to the convention
stipulated below in that the data revision code will be a capital letter
(e.g., A, B) instead of a numeric code. This will be the flag to indicate
to the user that these are Field data to be used only during the field study.
These files should be deleted as soon as possible after the study and replaced
with preliminary data files which will have some QA/QC performed.
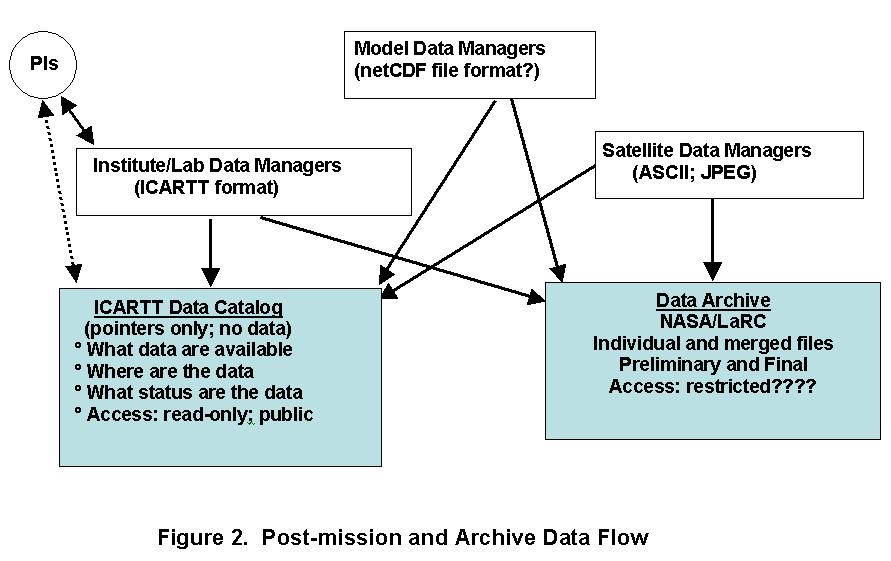
D. Post-mission data exchange deadlines
We introduce here the data catalog (see Figure 2). This is
a fully accessible (to the public) web site that is set up and maintained
by the Data Manager team. The data catalog does not contain data files, but
rather contains information about what data are available, what the status
is (field, preliminary, or final), and where the data can be accessed. This
is the central site where an investigator can go to find out what data were
taken during the study, what stage the data QA/QC process is at, and who
to contact to get the data. The data catalog provides openness without compromising
security. The DM team may decide to implement this data catalog prior to
the study as a means of providing an overview “at a glance” of the measurements
being conducted during the ICARTT study.
Preliminary data files should be submitted to the respective servers no later
than 01 January 2005. These files will be required to give PIs adequate time
for analysis prior to the anticipated data workshop in April, 2005. Final
data should be submitted no later than 01 June 2005.
E. Data archiving
The NASA LaRC group has agreed to accept all ICARTT data for
final archiving to a public database and to merge the data into an easily
usable format.
F. Responsibilities of data access
A major goal of this data management plan is to facilitate
the free exchange of data between and among various teams of researchers.
The intention of this data sharing is to broaden the interpretation of observations
and to exploit complementary data collected by different research teams.
While this level of access is desirable, there are clear responsibilities
that come with this access. It is appropriate and expected that researchers
may browse all data unfettered; however, once earnest research is pursued,
it is essential that relevant Principal Investigators will be made aware
that their data are being used. It is also expected that they will be offered
co-authorship and the opportunity to comment on the content of manuscripts
prior to submission for publication. It is imperative that Principal Investigators
be consulted when suspicious data is encountered or when interpretation of
data becomes dependent upon understanding the underlying technique.
It is customary for research teams to seek publication of results in an agreed
upon journal as a “special issue” or “special section”. It is also possible
that more than one research team may decide to pursue a common publication
schedule. It is expected that researchers will honor the publication schedules
agreed upon by their respective teams. Some researchers may decide to request
an exception to the publication schedule. Such exceptions can include results
of extremely high interest that would have immediate impact or interesting
results that are peripheral to the primary goals of ICARTT. Requests for
an exception to the publication schedule should be arbitrated by the primary
author’s science team.
Part II. Data File Formats
Click
here to view the latest updates for the ICARTT Data File Formats.
In a study this large there are many different types of data
collected. Many data sets are simply straight time series with one or a number
of parameters being measured sequentially (and simultaneously) in time. However,
there are some data sets that are truly multi-dimensional in that a sample
will be taken by an instrument at a single point in time and a number of
parameters will be measured on that sample simultaneously. An example is
wind profiler data in which a 30-minute averaged sample taken at some time
period will be binned into height information and at each height will be
wind speed, wind direction, and temperature. Another, more extreme, example
is output from 3- dimensional models. Data such as these clearly cannot be
represented as a single time series. Sections 1- 2 below outline the ICARTT
format for all types of data, with an emphasis on standard time-series types
of data. Section 3 - 4 is specific for standard timeseries types of data.
Section 5 offers guidance for non-standard time-series data.
Though adapted from the NASA Ames data format, the ICARTT data format will
have no restriction on the number of characters per line or on the number
of characters per record. The file name will be limited to 127 characters
in length. These features (and others; see below) will require modification
to some existing file reading and checking software (such as Ames). The NASA
LaRC group has agreed to create web-based checking software, accessible to
the ICARTT science team, to accommodate these changes.
1. Requirements for data files
A. Time information
The philosophy here is that the data in the files must possess
at least the minimum amount of accompanying information to uniquely identify
each data point - this generally means time and location information. Moreover,
the format must be able to handle all forms of timing configurations, including
data that are irregularly spaced in time. For example, there are instruments
that integrate a measurement over time until a certain signal-to-noise threshold
has been reached. The integration period varies according to atmospheric
conditions so that the resulting data have both variable integration times
and are irregularly spaced in time. There is absolutely no way to represent
these data with a single time point. The most efficient way of representing
these data is with two time points: starting time and stopping time. This
is the first requirement for the data file structure.
In those cases when many data sets are used or merged, a convenient single
time reference point is the mid-point of the sampling period(s). Generally,
this is the average of the start time and the stop time, but this is not
always the case. As an example, there are measurements that integrate over
a certain time but because of sample airflow changes (e.g., changing altitude
during aircraft sampling) the sampling volume mid point does not correspond
to the sampling time mid-point. In this case, the actual time midpoint must
be specified by the investigator. Thus in order to encompass all of the possible
diversity in sampling, three times need to be specified for each data point:
start time, mid-point time, and stop time.
There are different views on what format should be used to
represent time. In current measurement practice it is typical to find 1 second
sampling intervals regardless of the platform (i.e., aircraft, etc.). Measurements
at 1 Hz generally capture most of the important variablity in air quality
data, and, while longer intervals are commonly reported, shorter intervals
are not. The Ames format shows time as seconds from the start of
the day defined in the file header and in the file name (see below). The
ICARTT file format will adopt this structure. However, recognizing the need
in some cases for >1 Hz sampling, the ICARTT format will allow data in
fractional seconds though the default will be integer seconds. This does
not mean that data MUST be shown in 1 second increments; whether it be 1
minute or some other increment, this decision is left to the principal investigator.
In all cases, though, all times are explicitly accounted for in the period
(day) specified by the header and file name. If no data are available for
any time period, then that is represented by the missing data identifier.
The one exception to this is when no sampling takes place from the start
of a day to some point during the day. This might occur because of, for example,
aircraft take-off. All times are in UTC.
B. Location information
The specification of this information is straightforward. All
data points in the files need to have latitude (lat), longitude (lon), and
either altitude (for aircraft, lidars, sondes) or elevation (for surface
data). The lat/lon system used here will be strictly numeric: decimal degrees
(to five decimal places) with south latitudes and west longitudes represented
as negative numbers (i.e., no N, E, W, S identifiers). Elevations will be
in integral meters. Altitudes must be explicitly defined since many types
of altitude measurements are in use (pressure alt; GPS alt; geopotential
alt; etc.).
Because this information is required to uniquely identify any given data
point, ideally it is included in the file with those data. However, it is
sometimes advantageous to have location information consolidated and uniquely
identified in a separate file (e.g., an aircraft parameter file). If this
is done, then information about that parameter file must be included in the
data file header information. This will be specified below.
C. Measurements
In general, each file contains data of one parameter or species
separated by a space. Multiple variables per file are allowed only if all
were measured on exactly the same time base, as, for example, by the same
instrument (e.g., GC/MS; PILS/IC). The numeric representation of a variable
will be defined by the units in which it was measured. The ICARTT format
contains the NASA Ames provision for a data scaling factor. However, we recommend
that all scale factors be 1 unless it is grossly inconvenient to do so. If
very large or very small numbers are required, then they can be represented
with exponential notation, as in 1.01e9 or 5.23e-6.
i. Uncertainties
Every data point should have a corresponding total uncertainty
(or error) which has the same units as the measurement. This uncertainty
in the measurement is indicated as a TOTAL uncertainty to include all systematic
and random effects. Ideally, these uncertainties are tabulated as the next
(and separate) column after the data column in the file. However, this requirement
can be relaxed if the uncertainty data can be reproduced by information in
the header of the file. For example, if all uncertainties can be calculated
by a function that has any given data point as input, then the formula can
be included as header information.
ii. Missing data
Missing data are just that - missing. It makes no difference
what the reason, whether it be a calibration period, a system crash, instrument
maintenance, etc. Missing data are represented by negative numbers large
enough to never be construed as actual data. For the ICARTT file format the
value is -9999. Note that this is different from the Ames data exchange format
in that Ames requires missing data flags to be numbers larger than any “good” data
value. This somewhat arbitrary standard breaks down for measurements in urban
areas where “good” data values can exceed reasonable expectation. For example,
it is not uncommon in these areas for NO, NO2, or CO data to be in the parts
per million range which are very large numbers for the standard units of
measure (ppbv) for these species. On the other hand, there is no conceivable
situation in which large negative numbers (e.g., -9999) can be construed
as “good” data. Therefore, we specify for the ICARTT format that the primary
missing data flag be -9999.
On the other hand, data below (or above) the limit of detection (LOD) are
not actually “missing” but do convey some information. While some investigators
choose to tabulate all of their quantifiable data, including negative values,
others choose not to show these data points, but rather indicate the value
is less than (or greater than) some quantifiable limit. These conditions
will be indicated by two additional missing data flags that are substituted
for the missing data values. The flag for data values GREATER THAN some UPPER
LOD (ULOD) will be –7777, and the flag for data values LESS THAN some LOWER
LOD (LLOD) will be -8888. These flags (if used) and the values of the upper
and lower LOD are documented at specific locations in the header file (see
below).
2. Filenames
Features of different file naming conventions (including Ames)
have been adapted here. File names for the ICARTT data format, limited to
127 characters or less, are defined as follows:
dataID_locationID_YYYYMMDD[hh[mm[ss]]]_R#[_L#][_V#][_comments].extension,
where the only allowed characters are: a-zA-Z0-9_.- (that is, upper case
and lower case alphanumeric, underscore, period, and hyphen). All fields
not in square brackets are required and are described as follows:
dataID: short description of measured parameter/species,
instrument, or model (e.g., O3; RH; VOC; PTRMS; MM5)
locationID: short description of site; station; platform; laboratory
or institute
YYYY: four-digit year
MM: two-digit month
DD: two-digit day
hh: optional two-digit hour
mm: optional two-digit minute
ss: optional two-digit second
R: revision number of data
L: optional launch number
V: optional volume number
comments: optional additional information
extension: file type descriptor
The underscore is used ONLY to separate the different fields
of the file name; it has special significance for file-checking software.
To separate characters within a field for readability, use lower and upper
case letters. The use of the hyphen, though allowed, is discouraged since
this character in file names may cause problems with some older operating
systems and network software. The square brackets “[ ]” enclose optional
parameters but are not shown in the file name. Dates and times in file names
are always UTC. The date and time in the file name give the date/time at
which the data within the file begin (data files), or date/time at which
the image applies (image files). For aircraft and sonde data files, the date
always refers to the UT date of launch.
The dataID is a short string of characters used to
identify the parameters in the file. For files that contain one or two variables
those variable names can be used in the file name. For files in which many
variables are represented, it may be best to indicate in the file name a
class of compounds (e.g., VOC; PhotolysisRates) or an abbreviation of the
instrument used to make the measurements (e.g., PTRMS).
The locationID is used to identify the measurement platform,
site, station, or source (laboratory or institute) of the information within
a data file. Some examples could be: DC8, BAE146, RHBrown, GOME (satellite),
IoS (Appledore Island site), ChebPt (Chebogue Point site), and others. It
may be useful to have a standardized set of abbreviations used for the ICARTT
study. These should be decided upon by the DM team.
The R parameter will not be optional in the ICARTT study.
We must specify a data revision code that will track changes in data and
document why those changes occurred. For this we specify a revision number
counter “_R#” where the underscore is a required element to separate the
fields (this is needed for certain file checking software). The revision
number "#" must match the revision number specified in the Normal Comments
section of the file header (see below).
The optional parameters “_L#” and “_V#” may be needed in some
special cases. If the contents of the file pertain to a second or third aircraft
launch on the indicated date, then a launch counter "_L#" (i.e. L2, L3, etc.)
must appear after the "R" identifier but before a volume counter, if present
(see below). Launch number one is implied when "_L#" is omitted from the
file name. If a data file is one volume of a multi-volume dataset, then a
volume counter "_V#" (i.e. V1, V2, V3, etc.), must appear after the "R" parameter
(and the “L” parameter, if present) separated by an underscore from the rest
of the identifier. The volume number (the "#" in "V#") must match the volume
number in the file header. When "_V#" is missing from the file name a one-volume
dataset is implied.
The optional comments parameter is for additional information
required by the PI (or Data Manager) to identify the file contents but that
does not fit into the other fields of the file name. This should be used
sparingly.
The file extension is a 2-4 character parameter that identifies
the file type. The principal file type for the ICARTT study will be “.ict” and
describes the time series data in a file formatted to ICARTT standards. Other
file types may include:
“.txt” text file; not ICARTT formatted
“.jpg” image file
“.cdf” NetCDF file
These allowable file extensions will need to be defined by the team of Data
Managers.
3. Recommended File Format Specification for
ICARTT Time-series Data Files
A. Structure
We recommend that, whenever possible, ICARTT time series data files conform
to the following Ames file format:
FFI = 1001; one real, unbounded independent variable; primary
variables are real; no auxiliary variables; independent and primary variables
are recorded in the same record.
What this means in English is that there is one time (independent) variable
and that all other data depend on that variable. Any number of other variables
can be defined, but they all depend on the one. In the typical case the
fundamental variable is the start time of the measurement and others can
be defined
as in the following example, where the variable names refer to columns
in the data file:
start time
stop time
mid-point time
latitude
longitude
altitude/elevation
data variable1
variable1 uncertainty
data variable2
variable2 uncertainty
<etc.>
This format accounts for most time series data measured anytime, over
any arbitrary integration period, and at any place on or above the planet
(within reason for air quality data). Obviously, the format can be condensed.
For example, if measurements are reported as 1 second intervals, then stop
time and mid-point time need not be included as data columns provided all
time intervals in the measurement period are accounted for by inclusion
of the missing data flag(s). Similarly, if the measurements are made at
a fixed location then latitude, longitude, and elevation are fixed and
these data would be included in the header information (see below). As
pointed out above, if the location data (latitude, etc.) are included in
a separate file, then these columns can be excluded provided the location
data file name is included in the header information for the data file.
Similarly, if uncertainty is defined as some function that is the same
for all data points then that function can be included in the header information
and the user can then calculate uncertainties. Variations in the way the
format is used, based on the needs of the data provider, are accounted
for in the file header information. As an example, some PIs may wish to
report the END time of the measurement period as the independent variable.
The ICARTT format allows this provided that the time variable is clearly
labeled as such (e.g., End_UTC) and that additional information describing
this (non-standard) situation be provided in the Normal Comments section
of the file header. If the data periods are not of a constant duration,
then the start time and mid-point time of each period must be included
as an additional column and the Data Interval value set to 0 (see below).
The header specifications are described below.
B. File header information
The basic structure of the ICARTT file header is similar to
the Ames exchange format. For the ICARTT study we recommend some additional
information that will be included in the comments sections. The most general
header is shown below as an example; more specialized headers will be described
as modifications to the general form. Different items of information in the
same record (same line) are shown below as separated by a semicolon – in
the actual file they are separated by a single space.
-
Number of lines in header; file format index: most files
use 1001
-
PI name: last name, first name/initial
-
Organization/affiliation of PI
-
Data source description: e.g., instrument name; platform
name; model name, etc.
-
Mission name: this will be ICARTT_ followed by your project;
e.g., NEAQS, INTEX, etc.
-
File volume number; number of file volumes: These integer
values are used when the data require more than one file per day. For data
that require only one file these values are 1 1.
-
UTC date when data begin; UTC date of data reduction or
revision.
-
Data Interval: This value describes the time spacing (in seconds) between consecutive data
records. It is the (constant) interval between values of the independent
variable. For 1 Hz data the data interval value is 1; for 1 minute data
the value is 60;
for 2 Hz data the value is 0.5. If the data records include start AND stop
times, then the data interval value is 0.
-
Description or name of independent variable: This will
be the name chosen for the start time or in some cases the mid-point time
or end time of the data stream. It always refers to the number of seconds
from the UTC start of the day.
-
Number of variables: Integer value showing the number of
dependent variables (the total number of columns of data will be this value
plus one).
-
Scale factors: This will be 1 for all variables, except
where grossly inconvenient.
-
Missing data indicator: This will be –9999 for any missing data condition,
except for the main time variable which is never missing.
-
VVariable names: Name or description of data in that column.
When possible, we recommend that the variable name include units.
-
Number of SPECIAL comment lines: Integer value indicating
the number of lines of special comments, NOT including this line.
-
Special comments: Notes of problems or special circumstances
unique to this file. An example would be comments/problems associated with
a particular flight.
-
Number of Normal comments (i.e., number of additional lines
of SUPPORTING information): Integer value indicating the number of lines
of additional information, NOT including this line.
-
Normal comments (SUPPORTING information): This is the place
for investigators to more completely describe the data and measurement
parameters. The supporting information structure is described below as
a list of key word: value pairs. Specifically include here information
on the platform used, the geo-location of data, measurement technique,
and data revision comments. Note the non-optional information regarding
uncertainty, the upper limit of detection (ULOD) and the lower limit of
detection (LLOD) for each measured variable. The ULOD and LLOD are the
values, in the same units as the measurements that correspond to the flags –7777
and –8888 within the data, respectively. The last line of this section
should contain all the variable names on one line. The key words in this
section are written in BOLD for clarity below. The actual file will not
have special formatting codes. The key word must be typed followed by a
colon then followed by your text (information). When more than one value
(or information) is to be written on the same line, separate the values
using a semicolon. For lines where information is not needed or applicable,
simply enter N/A. The scanning program will look for these key words (case
insensitive) when the file is submitted.
PI_CONTACT_INFO: Phone number, mailing address, email address
and/or fax number.
PLATFORM: Platform or site information.
LOCATION: including lat/lon/elev if applicable.
ASSOCIATED_DATA: File names with associated data: location
data, aircraft parameters, ship data, etc.
INSTRUMENT_INFO: Instrument description, sampling
technique and peculiarities, literature references, etc.
DATA_INFO: Units and other information regarding data manipulation.
UNCERTAINTY: Uncertainty information, whether a constant value
or function, if the uncertainty is not given as separate variables.
ULOD_FLAG: -7777 (Upper LOD flag, always -7's).
ULOD_VALUE: Upper LOD value (or function) corresponding to
the -7777's flag in the data records.
LLOD_FLAG: -8888 (Lower LOD flag, always -8's).
LLOD_VALUE: Lower LOD value (or function) corresponding
to the -8888's flag in the data records.
DM_CONTACT_INFO: Name, affiliation, phone number, mailing
address, email address and/or fax number.
PROJECT_INFO: Study start & stop dates, web links, etc.
STIPULATIONS_ON_USE: (self explanatory)
OTHER_COMMENTS: Any other relevant information.
REVISION: R# (see filenames discussion above);
R#: comments specific to this data revision. The revision
numbers and the associated comments are cumulative in the data file.
This is required in order to track the changes that have occurred
to the data over time. Prepend the information to this section so
that the latest revision number and comments always start this part
of the header information. The latest revision data should correspond
to the revision date on Line 7 of the main file header. Note that
FIELD data files have revision LETTERS, not numbers.
Indep_Var VarName_1 VarName_2 VarName_3 … VarName_n
For accounting purposes, the following formulas may be useful
in identifying the number of lines of the header. If all key-value pairs in
the normal comments section such as PI_CONTACT_INFO are on one line each, the
number of normal comments is:
17 + (number of lines in the R# section)
The formula for the total number of lines in the header is:
12 + ( # dependent variables, given in line 10) + (1 + # special comments)
+ (1 + # normal comments)
C. Examples
Below are three examples of (similar) time series data using different forms
of header information. Be aware that the automatic word-wrap feature in word
processing programs gives the appearance that there are more lines of text
than are really there. In these examples any continuation of lines from directly
above has been indented for clarity.
EXAMPLE 1. All required data columns are
shown explicitly.
File name: NOX_RHBrown_20040830_R0.ict
41 1001
Williams, Eric
Aeronomy Laboratory/NOAA
Nitric oxide and nitrogen dioxide mixing ratios from R/V Ronald H. Brown
ICARTT_NEAQS
1 1
2004 08 30 2004 12 25
0
Start_UTC (number of seconds from 0000 UTC)
9
1 1 1 1 1 1 1 1 1
-9999 -9999 -9999 -9999 -9999 -9999 -9999 -9999 -9999
Stop_UTC
Mid_UTC
DLat
DLon
Elev
NO_ppbv
NO_1sig
NO2_ppbv
NO2_1sig
0
18
PI_CONTACT_INFO: Address: 325 Broadway, Boulder, CO 80305; email: eric@al.noaa.gov;
303-497-3226
PLATFORM: NOAA research vessel Ronald H. Brown
LOCATION: Latitude, longitude and elevation data is included in the data records
ASSOCIATED_DATA: N/A
INSTRUMENT_INFO: NO: chemiluminescence; NO2: narrow-band photolysis/chemiluminescence
DATA_INFO: All data with the exception of the location data is in ppbv. All
one-minute averages contain at least 35 seconds of data, otherwise missing.
UNCERTAINTY: included in the data records as variables with a _1sig suffix
ULOD_FLAG: -7777
ULOD_VALUE: N/A
LLOD_FLAG: -8888
LLOD_VALUE: N/A; N/A; N/A; N/A; N/A; 0.005; N/A; 0.025; N/A
DM_CONTACT_INFO: N/A
PROJECT_INFO: ICARTT study; 1 July-15 August 2004; Gulf of Maine and North
Atlantic Ocean
STIPULATIONS_ON_USE: Use of these data requires PRIOR OK from the PI
OTHER_COMMENTS: N/A
REVISION: R0
R0: No comments for this revision.
Start_UTC Stop_UTC Mid_UTC DLat DLon Elev NO_ppbv NO_1sig NO2_ppbv NO2_1sig
43200 43259 43229 41.00000 -71.00000 15 0.555 0.033 2.220 0.291
43260 43319 43289 41.01234 -71.01234 15 10.333 0.522 31.000 0.375
EXAMPLE 2 This example is similar to Example 1. Differences
include the exception of the elimination of variables stop time, mid time,
lat, lon, elev, and uncertainties, the inclusion of a special comment, the
inclusion of DM info, and a second revision comment.
File name: NOX_RHBrown_20040830_R1.ict
36 1001
Williams, Eric
Aeronomy Laboratory/NOAA
Nitric oxide and nitrogen dioxide mixing ratios from R/V Ronald H. Brown
ICARTT_NEAQS
1 1
2004 08 30 2004 12 25
60
Start_UTC
2
1 1
-9999 -9999
NO_ppbv
NO2_ppbv
1
Lightning struck the ship at ~ 14:00:23 UTC, or at 50423 seconds after midnight
UTC. The 13 minute section of missing data from 14:00 to 14:43 (50400 through
52780 of Start_UTC) reflects the period when the instrument was checked out
and the computer rebooted.
19
PI_CONTACT_INFO: Address: 325 Broadway, Boulder, CO 80305; email: eric@al.noaa.gov;
303-497-3226
PLATFORM: NOAA research vessel Ronald H. Brown; sampling through high-flow
manifold (res. time ~ 1 s) at 15 m above waterline
LOCATION: Ship location data in file ShipData_RHBrown_20040830_R0.ict
ASSOCIATED_DATA: ShipData_RHBrown_20040830_R0.RHB
INSTRUMENT_INFO: NO: chemiluminescence; NO2: narrow-band photolysis/chemiluminescence,
See Williams et al., BigScience, 42, p. 50-51, 2001
DATA_INFO: Units are ppbv. All one-minute averages contain at least 35 seconds
of data, otherwise missing. Midpoint time is 29 seconds after the minute.
One second data are available, contact the PI.
UNCERTAINTY: NO: +/-(5%+0.005 ppbv); NO2: +/-(12%+0.025 ppbv)
ULOD_FLAG: -7777
ULOD_VALUE: N/A
LLOD_FLAG: -8888
LLOD_VALUE: 0.005; 0.025
DM_CONTACT_INFO: Donna Sueper; NOAA/AL; dsueper@al.noaa.gov. Data manager
for data within ShipData_RHBrown_20040830_R0.ict is Jim Johnson with PMEL,
James.Q.Johnson@noaa.gov
PROJECT_INFO: ICARTT study; 1 July-15 August 2004; Gulf of Maine and North
Atlantic Ocean
STIPULATIONS_ON_USE: Use of these data requires PRIOR OK from the PI
OTHER_COMMENTS: N/A
REVISION: R1; R0
R1: NO2 data have been increased by 13% based on calibration standard recheck.
R0: No comments for this revision.
Start_UTC NO_ppbv NO2_ppbv
43200 0.555 2.509
43260 10.333 35.030
EXAMPLE 3. This example is similar
to examples 1 and 2. Here the platform is a ground site with a locationID of
ChebPt.
File name: NOX_ChebPt_20040830_R2.ict
36 1001
Williams, Eric
Aeronomy Laboratory/NOAA
Nitric oxide and nitrogen dioxide mixing ratios from Chebogue Point, Nova Scotia
ICARTT_NEAQS
1 1
2004 08 30 2004 12 25
60
Start_UTC
2
1 1
-9999 -9999
NO_ppbv
NO2_ppbv
0
20
PI_CONTACT_INFO: Address: 325 Broadway, Boulder, CO 80305; email: eric@al.noaa.gov;
303-497-3226
PLATFORM: 10 m tower at the Chebogue Point ICARTT research site.
LOCATION: Chebogue Point, Nova Scotia, Canada; lat: 43.45678; lon: -66.00000;
elev: 30 m.
ASSOCIATED_DATA: Met_ChebPt_20040830_R2.ict
INSTRUMENT_INFO: NO: chemiluminescence; NO2: narrow-band photolysis/chemiluminescence.
DATA_INFO: All data is in units of ppbv.
UNCERTAINTY: NO: +/-(5%+0.005 ppbv); NO2: +/-(12%+0.025 ppbv)
ULOD_FLAG: -7777
ULOD_VALUE: N/A
LLOD_FLAG: -8888
LLOD_VALUE: 0.005; 0.025
DM_CONTACT_INFO: Donna Sueper; NOAA/AL; dsueper@al.noaa.gov
PROJECT_INFO: ICARTT study; 1 July-15 August 2004
STIPULATIONS_ON_USE: Use of these data requires PRIOR OK from the PI
OTHER_COMMENTS: N/A
REVISION: R2; R1; R0
R2: NO data have been decreased by 13% based on operator ineptitude.
R1: NO2 data have been increased by 13% based on calibration standard recheck.
R0: No comments for this revision.
Start_UTC NO_ppbv NO2_ppbv
43200 0.483 2.509
43260 0.899 35.030
4. Recommended File Format Specification for
ICARTT Multi-dimensional Data Files
Also, view the "Amended
FFI 2310" document for more details on this File Type.
A. Structure
We recommend the standard Ames file format, FFI=2310, for exchange
of most multidimensional data files associated with the ICARTT study. The FFI
descriptor is:
FFI 2310; two real independent variables, one unbounded
and one bounded with its number of constant increment values, base value, and
increment defined in the auxiliary variable list; primary variables are real;
auxiliary variables are real;
For a more complete description, please see the Ames file format document at
the web site listed in Part I. The following is based on an example in that
document. The text in italics indicates comments not in the file but those
added here for clarity. The normal comments section mimics that in the Ames1001
format described above.
EXAMPLE
File name: LidarO3_WP3_20040830_R0.ict
46 2310
Williams, Eric
NOAA Aeronomy Laboratory
Ozone number density profile from WP3 aircraft lidar
ICARTT_ITCT
1 1
2004 08 30 2009 09 04
60.0
Geometric altitude of observation (m)
Elapsed time in UT seconds from 0 hours on day given by date
1 {Number of PRIMARY variables}
1.0e9
-9999
O3 number density
9 {Number of AUXILIARY variable}
1.0 1.0 1.0 1.0 1.0 1.0 1.0 1.0 1.0
-9999 -9999 -9999 -9999 -9999 -9999 -9999 -9999 -9999
number of altitudes at current time mark
geometric altitude (m) at which data begin
altitude increment (m)
geometric altitude of aircraft (m)
UT hour
UT minutes
UT seconds
aircraft longitude (deg)
aircraft latitude (deg)
0
18
PI_CONTACT_INFO: Address: 325 Broadway, Boulder, CO 80305; email: eric@al.noaa.gov;
303-497-3226
PLATFORM: NOAA WP3
LOCATION: Lat, Lon, and Alt included in the data records
ASSOCIATED_DATA: N/A
INSTRUMENT_INFO: Differential absorption lidar. See Williams et al., BigScience,
42, p. 50-51, 2001
DATA_INFO: The units are number density (#/cc). The vertical averaging interval
is 975 m at 1-7 km above the aircraft and 2025 m > 7 km above the aircraft.
Horizontal averaging interval: 60 km.
UNCERTAINTY: N/A
ULOD_FLAG: -7777
ULOD_VALUE: N/A
LLOD_FLAG: -8888
LLOD_VALUE: N/A
DM_CONTACT_INFO: N/A
PROJECT_INFO: ICARTT study; 1 July-15 August 2004
STIPULATIONS_ON_USE: Use of these data requires PRIOR OK from the PI
OTHER_COMMENTS: N/A
REVISION: R0
R0: No comments for this revision.
UT_TIME Num_altitudes geo_alt_begin alt_increment geo_alt_aircraft UT_hour
UT_min UT_sec Lon_aircraft Lat_aircraft Array_O3_NumDensity[]
30300 26 12819 75 10389 8 25 35 -133.24 -9.45
1340 1519 1660 1779 1868 1939 1973 1992 1989 1955 1934 1897 1817 1721 1619
1514 1434 1343 1258 1203 1140 1088 1037 956 892 878
30360 22 12819 75 10383 8 26 0 -133.22 -9.93
1351 1523 1658 1774 1860 1930 1962 1974 1966 1932 1909 1877 1803 1706 1600
1493 1407 1310 -9999 -9999 1094 1045
Note that this file uses a scale factor (1e9) for the number density data since
it would be very cumbersome to add the exponential notation to every value.
Also, this example was adapted from the NASA document and did not have uncertainty
or flag values associated with the data.
5. File Formats for Other Data
Data collected during the ICARTT study for which a standard time-series
format does not apply can be formatted according to standards common to the
user community and agreed to by the Data Management Working Group. For many
modeling data sets the data files are generally stored in net.cdf format, which
is a de facto standard for that community and will serve for the ICARTT study
as well. However, the multi-dimensional data format defined above can accommodate
these data sets and we leave this as an optional format. For some instruments
(e.g., lidars), data are available as image files usually in standard formats
such as GIF or JPEG. Not all software for reading and writing these formats
allow additional text information (e.g., as a header) so the file names for
these files must be defined to include as much information as possible. If
necessary, the Data Management team will work with these PIs to achieve a mutually
acceptable solution.
Data acquired by sensors on satellites are not conveniently incorporated
into the ICARTT format. The data protocol allows each data record to be
identified
with a single timestamp only if data are reported continuously with a constant
time interval (e.g., 1 second). Otherwise, start and stop times must be reported,
and a data interval of 0 is entered on line 8 of the file header. Satellite
data are unique in that while they are recorded on a constant data interval,
significant
gaps in the data may exist. These gaps may be due to cloud interference, changes
in viewing mode (e.g., nadir versus limb), or other considerations. Given the
sheer volume of data and the file sizes associated with satellite observations,
it is not sensible to populate these data gaps with missing data values. It
is also unreasonable to report start and stop times since data are typically
collected
on short timescales (typically sub-second) such that integration time is not
an issue. Instead, satellite data files will report a data interval of -1 on
line 8 of the file header. This signifies that each data record is identified
by a single timestamp, but the actual timeline is discontinuous.
In general, if problems or difficulties arise the Data Management Working
Group will deal with them on a case-by-case basis. We want to ensure that
all data
that are collected during the ICARTT study are made available to all participants
as quickly and as seamlessly as possible. We welcome any comments or suggestions.
|
|
|