URI Instrument Description
Hydrogen Peroxide, Methylhydroperoxide and
Formaldehyde Transport and Chemical Evolution over the Pacific
Dr.
Brian G. Heikes, Center for Atmospheric Chemistry Studies, Graduate
School of Oceanography, University of Rhode Island,Narragansett,
RI 02882-1197.
Telephone:
401-874-6638; Fax:: 401-874-6898; email: zagar@notos.gso.uri.edu
Dr. Daniel
W. O'Sullivan, Dept. of Chemistry, United States Naval Academy,
572 Holloway Rd., Annapolis, MD 21402.
Telephone:
410-293-6618; Fax: 410-293-2218; email: dano@brass.mathsci.usna.edu
Measurements of hydrogen peroxide (H2O2) and
methylhydroperoxide (CH3OOH) will be made using a technique described
by Lee et
al., 1995. This technique has successfully been
employed as a method of quantifying hydroperoxide concentrations
aboard both the
DC-8 and P3-B during previous PEM missions.
Aqueous collection using continuous flow glass scrubbing coils
allows for 99%
collection efficiency for H2O2 and approximately
60% for CH3OOH. Quantitative analysis aboard both planes will
be conducted using
high performance liquid chromatography (HPLC)
as described by Lee et al., 1995. Hydroperoxides are separated
using reverse phase
HPLC followed by a derivatization reaction between
the particular hydroperoxide and peroxidase producing a fluorescent
dimer
(6,6'-dihydroxy-3,3'biphenyldiacetic acid).
The production of this dimer is proportional the quantity of
the reacting hydroperoxide.
Two HPLC systems will be flown aboard the DC-8
permitting a sampling time of 2.5 minutes. One HPLC system will
be flown on the
P3-B which will analyze H2O2 and CH3OOH every
5 minutes. The in-field detection limit for H2O2 is better than
10 ppt while the
detection limit for CH3OOH changes from better
than 15 ppt near the surface to 30 ppt at 40,000 ft. due to a
decrease in the
collection efficiency with lower sample pressure.
The detection limit and precision of the measurements are defined
as 3-times and
2-times the standard deviation of the analytical-procedural
blank. Blanks will be determined by flowing UHP Zero Air through
the
inlet manifold and by diverting the ambient
sample stream through O3-elimination catalyst prior to sample
collection. Both aqueous
and gas phase standards will be used for instrument
calibrations.

FIGURE 1. Schematic diagram of
HPLC peroxide system.
Formaldehyde (CH2O) will be measured on both
the DC-8 and P3-B using the method described by Lazrus et al.,
1988. Dual channel
collectors and fluorometers allow for continuous
measurements to be made resulting in 1 minute averages covering
approximately
50% of the sampling time. The detection limit
for this method is approximately 50 ppt but is dependent upon
water quality and
fluorescence instrument environmental factors
which change frequently. The detection limit is defined as 3-times
the standard
deviation of the analytical-procedural blank.
Blanks will be determined by replacing the sample air stream
with UHP Zero Air passed
through molecular sieve material. Both aqueous
and gas phase standards will be used for flourometer calibrations.
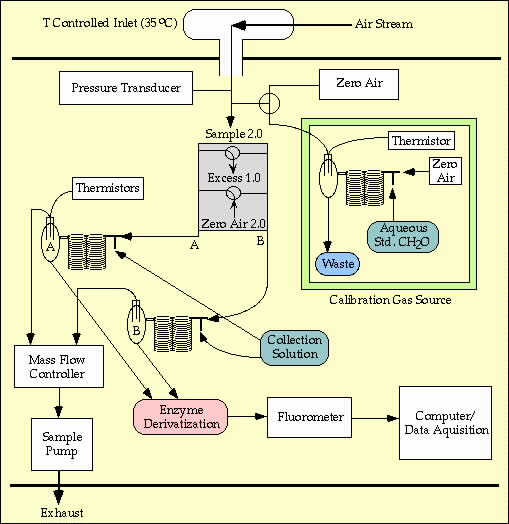
FIGURE 2. Sample collection schematic
for CH2O system; the peroxide collection system is similar.
Air samples are collected using a "diffuser
probe" inlet, gas-to-aqueous collection coils, and venturi
exhaust ports. The diffuser
permits sampling of gases in clouds at low ambient
pressure. The venturi-diffuser combination allows for sampling
without
electro-mechanical pumps below 35 kft.
REFERENCES
Lee, M., D. O'Sullivan, K.B. Noone, B.G. Heikes.
HPLC method for determination of H2O2, C1 and C2 hydroperoxides
in the
atmosphere. Journal of Atmospheric and Oceanic
Technology. 12, 1060-1070, 1995.
Lazrus, A.L., K.L. Fong, J.A. Lind. Automated
fluorometric determination of formaldehyde in air. Analytical
Chemistry, 60,
1074-1078, 1988.