Contributed
by:
R.J. McNeal, NASA Headquarters, D.J. Jacob, Harvard
University, and D.D. Davis and S.C. Liu, Georgia Institute
of Technology, USA
1. Introduction
The NASA
Global Tropospheric Experiment (GTE) is a program of
aircraft-based experiments dedicated to improving our knowledge
of global tropospheric chemistry and of its implications
for the biosphere, climate, and stratosphere. The program
arose in the late 1970's and early 1980's to address science
priorities established in a National Academy of Sciences
study (NAS, 1984). It has taken advantage of NASA's research
aircraft fleet, technological innovation, and experience
in managing large-scale projects.
Changes in the levels of tropospheric
chemical species are key observables in greenhouse gas
buildup and in degradation of air quality in clean air
regions of the world. The troposphere is also the ultimate
source and sink for trace gas species in the stratosphere,
so a full understanding of stratospheric ozone depletion
is not possible without an understanding of tropospheric
chemistry. The scale of such phenomena makes tropospheric
chemistry a natural, highly important target for space
observations. NASA is developing systems that, early
in the next decade, will provide global-scale tropospheric
chemistry observations of some key species from space.
With a few notable exceptions, such as distributions
of H2O, CO, CO2 and O3,
most tropospheric chemistry studies by NASA have so far
been conducted from aircraft.
The NASA aircraft provide
excellent platforms for the investigation of chemical
and transport processes in the troposphere. They can
sample with high vertical resolution through the depth
of the tropospheric column over an extended range, and
they can carry a large payload of in situ measurements
that is particularly effective when complemented with
ground-based and sonde measurements. They also will play
a particularly important role in calibration and validation
of future tropospheric chemistry space measurements.
The measurement of tropospheric
composition from aircraft has a relatively short history.
Twenty years ago, reliable instrumentation was available
only for O3, CO, and a few long-lived gases
and only with relatively poor time resolution. The measurement
requirements of global tropospheric chemistry are very
challenging. A long-standing commitment of GTE has been
to meet this challenge by (1) broadening the ensemble
of species measured from aircraft; (2) increasing the
accuracy, time resolution, and compactness of instrumentation;
and (3) developing new technology for chemical flux measurements.
GTE has conducted the Chemical Instrumentation Test and
Evaluation (CITE) series of missions to provide rigorous,
double-blind instrument intercomparisons as a necessary
step to gain confidence in the data base being generated.
This activity has resulted in high-quality aircraft payloads
that have provided in situ characterization of
a large ensemble of species needed to address global
tropospheric chemistry questions.
Guided by science priorities
of the tropospheric chemistry community, GTE has conducted
missions in diverse parts of the world that are particularly
important in understanding atmospheric chemical change
(Table 1, Figure 1). The ABLE experiments
focused on the surface sources and sinks of atmospheric
gases and aerosols and the meteorological processes that
mix such gases into the boundary layer and the free troposphere.
The TRACE-A and PEM projects
measured the distributions of aerosols and gases over
a greater altitude range (up to 12 km) and over very
wide geographical areas They have provided a baseline
against which to measure future pollution impacts on
the remote troposphere and defined a test bed for tropospheric
chemistry process models.
| Table
1. Field Missions of the Global Tropospheric Experiment |
|
| --INSTRUMENT
INTERCOMPARISON-- |
|
| CITE-1A |
OH, CO, NO/Tropical
Environment |
November
1983 |
| CITE-1B |
OH, CO, NO/US
West Coast |
April 1984 |
| CITE-2 |
NO2,
HNO3, PAN/US West Coast |
August 1986 |
| CITE-3 |
SO2,
CS2. COS, H2S, DMS/N. and S.
Atlantic |
September
1989 |
|
| --FLUXES & BOUNDARY
LAYER EXCHANGE-- |
|
| ABLE-1 |
Tropical
Atlantic |
June 1984 |
| ABLE-2A |
Amazon, Dry
Season |
August 1985 |
| ABLE-2B |
Amazon, Wet
Season |
May 1987 |
| ABLE-3A |
Alaska |
August 1988 |
| ABLE-3B |
Canada |
July 1990 |
|
| --GLOBAL
SCALE PHOTOCHEMISTRY & TRANSPORT-- |
|
| PEM-West
A |
North Western
Pacific |
September
1991 |
| TRACE-A |
Tropical
Atlantic |
September
1992 |
| PEM-West
B |
North Western
Pacific |
March 1994 |
| PEM-Tropics
A |
Tropical & Southern
Pacific |
September
1996 |
| PEM-Tropics
B |
Tropical
Pacific |
March 1999 |
| TRACE-P |
North Western
Pacific |
March 2001 |
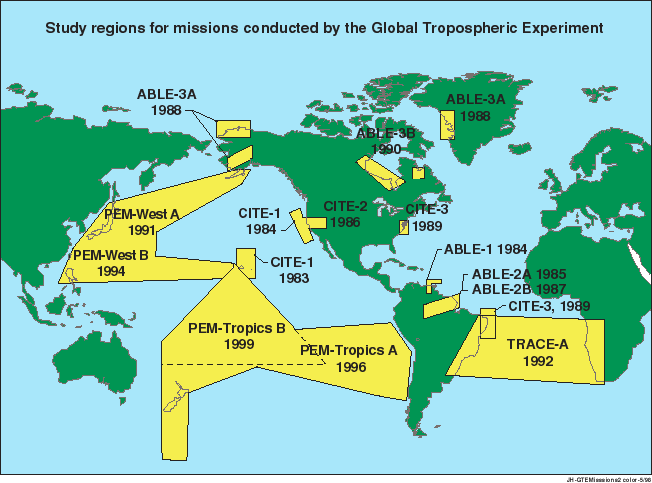
Figure 1. Study regions for
missions conducted by the Global Tropospheric Experiment.
The GTE experiments have produced
many important scientific results. Since ABLE
3-B in 1990, they have been conducted as IGAC experiments
with international partners. The entire GTE data base
is available to the public through the GTE home page
at http://www-gte.larc.nasa.gov.
The more recent GTE experiments
(PEM and TRACE-A),
conducted over the Pacific and Atlantic oceans, have
focused on the sources and sinks of O3 and
related gases (e.g., NOX, CO, hydrocarbons)
in the remote troposphere. They have examined the sources
of sulfur gases and the implications for aerosol formation,
and they have probed the long range transport and chemical
evolution of continental plumes. We review here some
of the major accomplishments from these recent missions
and briefly describe challenges and plans for the future.
2. Current Status of the
Aircraft Instrumentation
The primary platform for the
more recent GTE missions was the NASA DC-8
aircraft, which has a ceiling of 12 km, a cruising
speed of 800 km h-1, and a 10 hour flight
endurance. The latest PEM-Tropics A mission also deployed
a P-3B aircraft with ceiling of 8 km, cruising speed
of 500 km h-1, and 10 hour endurance. Figures
2a and 2b show the DC-8 and P-3B instrument payloads
in PEM-Tropics A. The DC-8 payload included in situ measurements
of O3, H2O, peroxides, CH2O,
CO, hydrocarbons, halocarbons, a suite of nitrogen compounds
(NO, NO2, peroxyacetylnitrate (PAN), HNO3),
organic acids, dimethylsulfide (DMS), SO2,
bulk aerosol composition, and UV irradiance. A differential
absorption lidar (DIAL) aboard the DC-8 measured ozone
and aerosol vertical profiles remotely in real time above
and below the aircraft (Browell et al., 1996).
These profiles are an important data product, and they
also provided a guide for adjustment of flight tracks
to exploit interesting measurement opportunities encountered
during flight.

Figure 2a. Instrument layout
on the NASA DC-8 Aircraft during PEM-Tropics A.

Figure 2b. Instrument layout
on the NASA P-3B Aircraft during PEM-Tropics A.
The DC-8 payload in PEM-Tropics
A included a new-generation instrument for sub-pptv measurements
of NO and NO2 that uses the photofragmentation
two-photon laser induced fluorescence (PF-TP-LIF) technique
(Sandholm et al., 1997; Bradshaw et al.,
1998). Accurate measurement of NO down to the pptv level
is necessary for quantifying the chemical production
of O3 in the remote troposphere. Figure 3
shows a sample vertical profile of NO concentrations
taken by this instrument over the South Pacific during PEM-Tropics
A. Concentrations of NO in the marine boundary layer
(MBL) were 1-2 pptv, well below the detection limit of
earlier instrumentation.
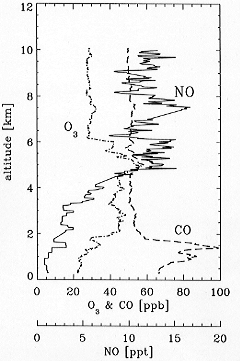
Figure 3. Vertical profiles
of NO, O3, and CO concentrations measured
northeast of Tahiti (4deg.S, 135deg.W) on 16 September
1996 during PEM-Tropics A.
The PF-TP-LIF instrument incorporated
a highly modified sample inlet system designed by Bradshaw et
al. (1998) to overcome potential decomposition of
complex nitrogen oxides in the inlet system, a suggested
source of interference in previous attempts to measure
NO2. The PEM-Tropics data show that the decomposition
problem has been substantially eliminated by the new
inlet design. Figure 4 compares the NO/NO2 concentration
ratios measured in PEM-Tropics
A to the values computed with a photochemical steady
state model (Schultz et al., 1998; see also Bradshaw et
al., 1998). Remarkable agreement is found, in sharp
contrast to results from PEM-West
A where the deviation between predicted and observed
NO2 was nearly a factor of 4 (Crawford et
al., 1996). Even in the MBL with NO concentrations
below 1 pptv, the agreement is within 30% and the variance
is well captured.
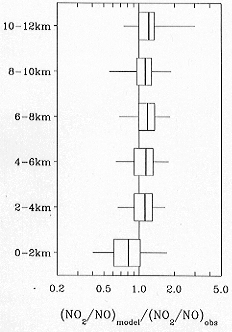
Figure 4. Comparison of observed
NO2/NO concentration ratios in PEM-Tropics
A to values computed by a photochemical equilibrium model
constrained with the ensemble of other aircraft observations.
Statistics are shown in 2 km altitude bands for the ensemble
of 1-minute observations made during the mission. Vertical
lines are median values, boxes extend over the central
50% of the data (25th to 75th percentiles), and horizontal
lines extend over the central 90% of the data (5th to
95th percentiles). From Schultz et al. (1998).
The P-3B payload in PEM-Tropics
A included measurements of O3, H2O,
OH, peroxides, CO, hydrocarbons and halocarbons, NO,
a suite of sulfur species (DMS, SO2, methanesulfonic
acid(g), H2SO4(g), non-seasalt
sulfate, and methanesulfonate), and aerosol composition
and size distributions, including ultrafine particles.
The OH measurements were made with the Chemical Ionization
Mass Spectrometry (CIMS) technique (Eisele and Tanner,
1991). The measurement of OH from aircraft with other
techniques has a long and difficult history (Crosley,
1995). The ground-based version of the CIMS instrument
had previously been intercompared successfully with
a long-path absorption instrument (Mount et al.,
1997), and the aircraft version performed extremely
well in PEM-Tropics A (Mauldin et al., 1998a).
Values measured in the MBL near Christmas Island are
shown in Figure 5 and clearly demonstrate a detection
sensitivity in the range of 105 cm-3 (Davis et
al., 1998).
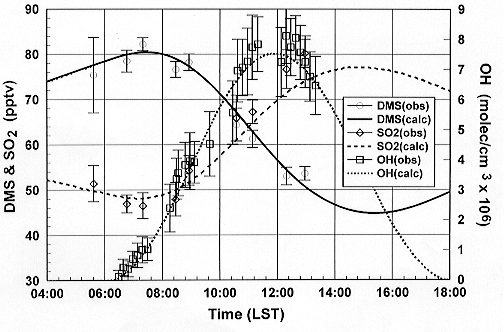
Figure 5. DMS, SO2,
and OH comparison: Model simulation vs. observation made
during NASA GTE PEM-Tropics A, P-3B Flight 7 near Christmas
Island, August 24, 1996.
3. Sources and Sinks of Tropospheric
Ozone and NOX
A major objective of the TRACE-A and PEM missions
was to improve understanding of O 3 production
and loss in the remote troposphere. A strikingly consistent
picture of the factors that control remote tropospheric
O3 has been developed, which is markedly different
from the prevailing view of 20 years ago. NOX levels
drive ozone photochemistry, and tropospheric NOX levels
are sufficiently high that photochemical production dominates
the stratospheric flux in controlling column O3 density.
Stratospheric intrusions where they occur are dramatic
events that strongly impact on the tropospheric ozone
column density locally, but the relentless photochemical
production of O3 on a global scale, driven
by NOX from ever-growing global sources, ultimately
dominates the tropospheric O3 budget.
In the GTE missions, column
O3 production and loss rates are products
derived from models that are run using the large base
of reliable data gathered during the aircraft flights.
During PEM-West B (February-March, 1994) the column O3 photochemical
production rate at subtropical latitudes (Crawford et
al., 1997a , Figure 6) is nearly 12 times larger
than the nominal average northern hemispheric flux of
O3 from the stratosphere (Mahlman et al.,
1980). Such high production rates are a consequence of
high levels of NOX from low altitude continental
outflow of industrial emissions from Asia. During PEM-West
A (September-October, 1991) the NOX concentrations
were generally lower, but the corresponding O3 production
rate at subtropical to mid-latitudes was still nearly
6 times the average stratospheric flux (Davis et al.,
1996). The difference in NOX levels between
the two missions was a result of the seasonal variation
in Asian outflow of NOX pollution to the western
Pacific, which is strongest in early spring (Merrill et
al., 1997). Column production rates of O3 in
PEM-Tropics A were comparable to those in PEM-West A
(Schultz et al., 1998). Column production rates
over the South Atlantic during TRACE-A were
considerably higher, reflecting the strong influence
of biomass burning (Jacob et al., 1996; Thompson et
al., 1996).
Figure 6. Diurnal-averaged
column-integrated values of (a) production of O3,
F(O3); (b) destruction of O3, D(O3);
and (c) net production of O3, P(O3).
Values are calculated from time dependent box model using
median observed conditions for PEM-West A (18-42deg.N)
and PEM-West B (20-30deg.N). Total tropospheric column
amounts are annotated at the bottom of the figure.
The argument for the dominance
of photochemistry is not based on column production rates
alone. Photochemical loss rates are not driven by NOX concentrations,
which show large spatial and temporal variability, and
the loss rate calculations convincingly demonstrate the
importance of the photochemical source. The calculated
O3 loss rates from the PEM-West missions
were substantially larger at mid-latitudes than the stratospheric
O3 flux, and these loss rates would have led
to a much lower O3 concentration than was
observed, if the stratosphere were the only or even the
dominant source of O3. Interestingly, however,
the loss rate was smaller than the calculated photochemical
column production rate (Figure 5). Thus, the PEM-West
data show that on average there is net photochemical
production at mid-latitudes over the northwestern Pacific,
particularly in the upper troposphere. The western Pacific
is, therefore, an exporter of photochemically-produced
O3 to the eastern and the southern Pacific
regions, where the effect of local photochemical production
in determining O3 densities is smaller because
of lower NOX concentrations.
In the tropics, the ensemble
of data from the PEM and TRACE-A missions
suggest that O3 is largely determined by chemical
production and loss with less impact from O3 imported
by long range transport processes. In some cases net
production in the upper troposphere is balanced by net
loss in the lower troposphere (Davis et al., 1996;
Jacob et al., 1996). In TRACE-A, a close balance
between chemical production and loss of O3 was
found for the 0-12 km column (Jacob et al., 1996).
The tropical data from PEM-West A indicate a net chemical
loss in the 0-12 km column, which could, however, be
compensated by significant net production above the 12-km
ceiling of the aircraft, where NOX concentrations
are likely high (Davis et al., 1996) Indeed, recent
ER-2 aircraft measurements from campaigns of the NASA
Upper Atmosphere Research Program have demonstrated the
importance of the uppermost tropical troposphere as a
net source region for O3 (Wennberg et al.,
1998). The PEM-West B tropical measurements paint a complicated
picture of the O3 budget. (Crawford et
al., 1997b) characterized the data in terms of two
distinct regimes, "high NOX" and "low
NOX", depending on the degree of lightning
influence. In the high NOX case, chemical
production of O3 nearly balanced chemical
loss, while loss dominated in the low NOX case.
In PEM-Tropics A, chemical production of O3 balanced
only half of chemical loss in the 0-12 km column over
the South Pacific, but most of the missing source could
be ascribed to long-range transport from the tropical
continents. In this case the influx of O3 from
mid-latitudes appeared to be small (Schultz et al.,
1998).
The dominance of NOX-catalyzed
production as a source of O3 in the tropical
troposphere is illustrated in Figure 7 by the remarkably
tight correlation between O3 and NOX concentrations
at 4-8 km and 8-12 km altitude for the PEM-West A and
B, and TRACE-A missions (Crawford et al., 1997b).
The only points that deviate significantly from the correlation
curve are those with fresh NOX emissions from
lightning. Data from PEM-Tropics A show a similar correlation.
It appears therefore that O3 in the tropical
troposphere is largely controlled by tropical emissions
of NOX from lightning, biomass burning, and
soils. Ozone in the tropics is a major global source
of OH radicals (Logan et al., 1981). We conclude
that future perturbations to NOX emissions
in the tropics, as a result of industrialization, land
colonization, land use change, or climate change would
have profound implications for the oxidizing power of
the atmosphere.
Figure 7. Correlation plot
of O3 versus NOX for the tropical
marine free troposphere (20deg.S-20deg.N): (a) 8-12 km,
(b) 4-8 km. Data have been taken from GTE missions PEM-West
A (circles), PEM-West B (triangles), and TRACE-A (squares).
The GTE data focus attention
upon the pivotal question of the origins and distribution
of tropospheric NOX as the key to understanding
tropospheric O3. The assignment of a source
type and magnitude to NOX to a remote region
of the troposphere is, however, quite difficult. This
reflects in part the fact that NOX has both
surface and high altitude primary sources, and vertical
mixing processes blend the effects of the two. Also,
NOX, after being converted to longer lifetime
species such as HNO3 and PAN, can be chemically
recycled back to the active form through chemical processes,
thus providing a secondary NOX source.
During PEM-West A the largest
primary sources of NOX in the upper troposphere
were lightning and surface emissions carried aloft by
deep convection (Davis et al., 1996; Singh et
al., 1996; Wang et al., 1998). Crawford et
al. (1997b) suggested that during PEM-West B for
tropical marine regions the source of NOX was
variable, depending strongly upon the origin of the air
parcel being sampled. In some cases (e.g., the earlier
cited "low NOX" regime) the parcels
came from an oceanic region with considerable deep convection,
but no lightning, and the NOX appears to have
been predominantly of the chemically recycled type. For "high
NOX" parcels, trajectory analysis combined
with chemical tracer analysis strongly suggest that the
NOX in the air masses had its origin in lightning
and deep convection over southeast Asia/Indonesia (Crawford et
al., 1997b; Kawakami et al., 1997). This NOX was
transported to the detection point by high altitude winds.
In the latter case, then, NOX was influenced
by both primary sources and some recycling of HNO3.
For TRACE-A and PEM-Tropics A there is evidence at high
altitudes that some fast recycling mechanism for converting
HNO3 into NO2, not currently in
models, was operating to produce a substantial fraction
of the observed NOX (Jacob et al.,
1996; Singh et al., 1997; Schultz et al.,
1998).
At lower altitudes the atmospheric
lifetime of NOX against oxidation becomes
much shorter (i.e., 1 to 2 days), so that rapid decay
of NOX concentrations is expected away from
its major primary continental sources. Concurrent measurements
of NO, PAN, and HNO3 in the PEM and TRACE
missions have thus permitted a more complete analysis
of the chemical sources and sinks of NOX.
The results show that NOX in the marine atmosphere
below 6 km altitude is largely maintained by thermal
decomposition of PAN advected from the primary source
regions at both low and high altitudes (Jacob et al.,
1992, 1996; Crawford et al., 1997a,b; Schultz et
al., 1998). This was particularly evident during
PEM-West B at sub-tropical and mid-altitudes, where the
impact from strong continental outflow of anthropogenic
emissions (resulting in large PAN production) was extended
out into the Pacific more than 2000 km. Because of the
season of the year and the geographical region sampled,
biomass burning was the dominant source of atmospheric
PAN in both TRACE-A (Singh et al., 1996) and PEM-Tropics
A (Schultz et al., 1998). These findings again
emphasize the importance of PAN as a means of extending
the geographical range of influence of industrial emissions
as well as biomass burning in the photochemical production
of O3.
4. Biomass Burning Influence
on Global Tropospheric Chemistry
A central focus of the TRACE-A
and PEM-Tropics A missions was to investigate the global-scale
influence of biomass burning on the tropical troposphere.
Considerable burning takes place in the tropics during
the dry season and results in concentrations of combustion-derived
gases over the tropical continents that are comparable
to those found in polluted industrial regions (Crutzen et
al., 1990; Logan and Kirchhoff, 1986). Space-based
observations in the 1980's identified high concentrations
of CO in the free troposphere of the southern tropics
during the dry season (Reichle et al., 1990) and
an O3 maximum in the tropospheric column over
the south Atlantic (Fishman et al., 1990).
The TRACE-A mission (September-October
1992) was conducted in part to determine the origin of
this O3 maximum. Flights over Brazil, southern
Africa, and the South Atlantic showed high O3 associated
with biomass burning pollution (Fishman et al.,
1996; Olson et al., 1996). It was found that both
South America and southern Africa contribute to the O3 maximum
over the south Atlantic, with South American influence
dominating in the upper troposphere and African influence
dominating at lower altitudes (Thompson et al.,
1996).
The PEM-Tropics A mission
provided the first detailed data on atmospheric composition
over the South Pacific, the most remote region of the
tropical troposphere, during the dry season. Flights
from Fiji, New Zealand, Tahiti, Easter Island, and Guayaquil
frequently encountered layers of biomass burning pollution
in the 2-12 km column (Gregory et al., 1998; Schultz et
al., 1998; Talbot et al., 1998). O3 levels
in these layers were frequently in excess of 80 ppbv
and were associated with high levels of CO and other
tracers of biomass burning (C2H2,
C2H6, CH3Cl, CH3Br)
(Figure 8). Urban pollution tracers (e.g., C2Cl4)
were not enhanced. Hydrocarbon data indicated that the
biomass burning pollution layers were 1-3 weeks old.
The O3/CO enhancement ratio was typically
greater than 1, consistent with chemical production of
O3 and chemical decay of CO during aging.
Back-trajectory analyses and 3-dimensional transport
simulations showed that most of the layers originated
from fires in Africa and South America and were transported
to the South Pacific by strong westerly flow at subtropical
latitudes (Fuelberg et al., 1998). A few of the
layers could have originated from fires in Indonesia
and Australia. Flights along the west coast of South
America also showed some fresh biomass burning plumes
originating from that continent and transported westward
in the trade winds.
Figure 8. In situ profiles
of selected tracer species measured in a descent through
a biomass burning plume encountered near Tahiti.
Figure 9 shows the relationship
between O3 and CO concentrations observed
for the ensemble of DC-8 flights out of Tahiti and Easter
Island during PEM-Tropics A. The data at 4-8 km show
a remarkable positive correlation, implying that biomass
burning influence extends beyond the obvious enhanced
layers to make a major contribution to the regional O3 budget.
The same positive correlation is also found at 8-12 km,
although some stratospheric influence (high O3,
low CO) is also apparent in data south of Easter Island.
At 0-4 km the correlation disappears, which can be attributed
to rapid chemical loss of O3 in this region
of the atmosphere.
Figure 9. Relationship of
O3 and CO concentrations at different altitudes
measured in sorties out of Tahiti and Easter Island during
PEM-Tropics A in September 1996.
5. The Role of OH
The role of OH in controlling
tropospheric chemistry is well established from laboratory
kinetic studies and models. However, direct measurements
of OH in clean background air, free of complex organic
reactions, where the critical controlling species for
OH, as well as OH itself, have been simultaneously measured
have proven to be quite elusive. The problem is rendered
even more difficult by the fact that the most credible
tests of models require measurements extending from daylight
into twilight and night.
As noted above, the direct
measurement of OH on the P3-B during PEM-Tropics A by
Mauldin et al. (1998a) were highly successful.
The tropical marine environment sampled during this mission
was ideal for a photochemical experiment based on OH
detection. Understanding this setting is essential for
a comprehensive understanding of global HOX chemistry.
In PEM-Tropics A, a Lagrangian type sampling strategy
was employed which enabled the first near-continuous
set of observations to be recorded over a substantial
fraction of a diel cycle (see Figure 5). The concentrations
of OH are seen ranging from sunrise values near 105 cm-3 to
high noon maximum values of 8x106 cm-3. Using
concurrently measured values of the key controlling species
to constrain model calculations, the agreement between
model simulations and observations was found to range
from 5 to 20%. This suggests that for the tropical MBL,
the mechanisms in current models are representative of
those operating in the real atmosphere.
The OH data also have provided
the basis for a detailed examination of several other
important aspects of HOX photochemistry. Among
these is the role of OH in the oxidation cycle of biogenic
sulfur.
6. Sulfur Chemistry
The PEM campaigns have had
a significant focus on sources of atmospheric sulfur
compounds. During PEM-West A, Thornton et al. (1996)
reported that SO2 exhibited a marked increase
in concentration with altitude owing to two major sources.
One is the long range transport of northern hemispheric
anthropogenic emissions injected by convection over Asia.
The other is emissions from the Mt. Pinatubo volcanic
eruption in June 1991 into the stratosphere followed
by injections of stratospheric air back into the troposphere.
No clear gradient in SO2 was
observed in the upper troposphere during PEM-West B,
and the concentrations of SO2 also were significantly
lower than in PEM-West A (Thornton et al., 1997).
Thornton et al. (1997) also concluded that during
PEM-West A and B the oxidation of DMS, on average, was
a relatively insignificant source of SO2 in
the free troposphere. However, of some interest was one
particular observation by Thornton et al. (1997)
and Talbot et al. (1997) in which there was a
coincidence of elevated concentrations of DMS, SO2,
NO and CN. This observation was recorded above 9 km in
the tropical convergence zone during PEM-West B and supports
earlier observations by Clarke (1993) showing the production
of new particles at high altitude from natural sulfur
sources.
Direct measurements of OH
during PEM-Tropics A (Mauldin et al., 1998a) made
possible more quantitative evaluations of the natural
sulfur cycle. Of special interest was the oxidative cycle
for DMS, the largest natural sulfur source globally,
and the largest single sulfur source over much of the
world's oceans (Andreae et al., 1985, Bates et
al., 1992). For this vast region, therefore, DMS
oxidation also represents the largest source of sulfate
aerosol and, hence, cloud condensation nuclei (CCN).
The latter play a major role in defining the radiative
properties of clouds and therefore represent a critical
component in effort to understand climate forcing by
aerosols (Charlson et al., 1987). The results
from PEM-Tropics A have significantly improved our understanding
of the basic chemical processes involved in the conversion
of DMS to sulfate and the formation of new particles.
During the equatorial PEM-Tropics
A Lagrangian experiment, simultaneous measurements of
OH, DMS, SO2, methanesulfonic acid (MSA(g)),
H2SO4(g), methanesulfonate (MS),
and non-seasalt sulfate (NSS), as well as critical meteorological
parameters, permitted one of the most intensive examinations
yet of the detailed chemical processes involved. As shown
in Figure 5, the decrease in DMS following sunrise is
consistent with the diel cycle of OH, the latter being
a major oxidizing species for DMS. Concomitant with the
decrease in DMS, there also is seen a major increase
in SO2. Model simulations using these data
suggest that the oxidation of DMS by OH was responsible
for 90 to 95% of the SO2 produced from DMS,
and that for the boundary layer this was the dominant
source of SO2 (Davis et al., 1998;
Thornton et al., 1998).
An internally consistent picture
involving SO2 also was developed showing that
only a small fraction of this species is lost to the
ocean's surface. Most of the SO2 forms NSS
but the oxidation pathway primarily involves heterogeneous
reactions, including in-cloud processes. Far more surprising
was the finding that MS in the boundary layer was also
entirely derived from heterogeneous in-cloud processes
(Davis et al., 1998). Although details are still
lacking, it appears that the nature of the heterogeneous
chemical processes for these two DMS end products is
quite different. This raises an interesting question
concerning the use of the frequently cited MS/NSS ratio
for sulfur source apportionment purposes for marine regions
of the world.
Farther to the East, near
the coasts of Costa Rica and Panama, a quite different
boundary layer sulfur experiment was performed. Unique
to this setting was the presence of a very active ITCZ
in the near vicinity of a coastal shelf, where there
was high biological productivity and release of significant
DMS. This was an ideal setting for examining the evolution
of the natural sulfur cycle under conditions where aerosol
surface area was minimized from precipitation scavenging.
In fact, the measured surface area was more than an order
of magnitude less than typically found for the MBL. Observed
H2SO4(g) levels were also higher
by nearly the same amount (Mauldin et al., 1998b).
This setting allowed the formation of new ultrafine particles,
a process never recorded before in the MBL, but detected
in PEM-Tropics A. A combination of observations and modeling
showed that this nucleation event was a direct result
of oxidation processes occurring within the natural sulfur
cycle, starting with the oxidation of DMS via OH to produce
SO2 (Clarke et al., 1998). Equally
significant was the finding that classical binary nucleation
theory failed to predict this event without the use of
a very large "tuning factor". This may point
to a deficiency in classical theory or, we suspect more
likely, to alternative mechanisms, e.g., ternary nucleation.
What is quite clear is that
this unique observation of a tropical nucleation event
will provide a solid experimental foundation from which
new theories can be tested. Thus, the outcome of these
new observations should have a significant impact on
our understanding of the relationship between aerosols
and global climate change.
7. Asian Outflow
The PEM-West missions investigated
the chemical composition of the western Pacific atmosphere
under different seasonal regimes of outflow from the
Asian continent. The meteorological differences between
PEM-West A and B can be characterized by the position
and strength of the Japan Jet and the location of the
Pacific High (Merrill et al. , 1997). During PEM-West
A, the Japan Jet tended to be weaker and positioned more
northerly than during the PEM-West B. As a result, PEM-West
A was characterized by more inflow of marine and southern
hemispheric air into the mid-tropical latitudes, accompanied
by extensive vertical mixing along a typhoon storm track
that ran roughly parallel with the Asian coast. The continental
outflow into the lower troposphere tended to be limited
to latitudes above 40deg.N.
In contrast, the PEM-West
B period was characterized by enhanced continental outflow
throughout the study region. During PEM-West B, at latitudes >20deg.N,
high velocity strong westerlies transported Asian pollutants
thousands of kilometers from the coast within 2 to 3
days after passage of a cold front. The pollutants were
generally confined to below 6 km during PEM West B. Stronger
convective events during PEM-West A transported pollutants
to the upper troposphere and then strong westerlies carried
them out to the Pacific basin (Blake et al., 1996;
Liu et al., 1996). The implication of quick transport
is that Asian outflow, enhanced in pollutants, arrives
at remote ocean sites relatively "fresh" in
terms of potential for photochemistry--a very important
finding (Newell et al., 1997; Crawford et al.,
1997a).
Three independent methodologies
were employed to classify air masses: the backward trajectory
method (Gregory et al., 1996; Talbot et al.,
1996, 1997), the tracer signature method (Browell et
al., 1996; Blake et al., 1997), and the hydrocarbon
ratio method (Smyth et al., 1996). For example,
Blake et al. (1997) demonstrated that in both
mid-latitude (>25deg.N) and low-latitude (<25deg.N)
regions, the anthropogenic non-methane hydrocarbon (NMHCs)
mixing ratios in the upper troposphere during PEM-West
A were discernibly higher than those observed during
PEM-West B. This is particularly significant because
the NMHCs in the lower troposphere tend to have seasonal
maxima in winter or early spring (near the time of PEM-West
B) because of the lower concentration of OH during the
winter. In addition, the observed distributions of NMHCs
and CO indicated clearly that the upper tropospheric
distributions of trace species with photochemical lifetimes
of about a week or longer were strongly influenced by
air masses that originated in the upwind regions of Asia,
i.e., Europe and beyond (Liu et al., 1996; Smyth et
al., 1996; McKeen et al., 1996).
The question of the outflow
from continents and the chemical evolution of the outflow
is expected to become increasingly urgent as the population
rises and the economic activity increases on a per capita
basis in the emerging and developing world, and it will
be a major focus of future experiments.
8. The Next Mission
The next GTE mission, PEM-Tropics
B, will be conducted in January-April 1999 as a sequel
to PEM-Tropics A. It will involve two aircraft, the DC-8
and P-3B, operating out of Hawaii, Christmas Island,
Tahiti, Fiji, and Easter Island. January-April is the
wet season of the southern tropics, and biomass burning
influence is then minimal (Kirchhoff et al., 1991;
Olson et al., 1996); burning during that time
of year is concentrated in the northern tropics. PEM-Tropics
B will thus provide an important complement to PEM-Tropics
A. Ozonesonde data at Fiji, Tahiti, and Easter Island
indicate lower O3 levels in January-April
than in September-October, and none of the high O3 layers
(>80 ppbv) that are observed in September-October.
Surface O3 at Samoa is at its seasonal minimum,
averaging only 10 ppbv (Oltmans and Komhyr, 1986). The
large-scale minimum of tropospheric O3 over
the Equatorial Pacific (Routhier et al., 1980;
Piotrowicz et al., 1991) is particularly extensive
in January-April, stretching from the western Pacific
warm pool to South America (Fishman et al., 1990).
Some biomass burning influence could still be present
during PEM-Tropics B due to long-range transport from
the northern tropics. Asian outflow circulating around
the Pacific High also could provide a source of trace
gases over the Equatorial Pacific (Merrill et al.,
1985; Merrill, 1989). Lightning over Oceania will be
near its seasonal maximum during the PEM-Tropics B period
(Turman and Edgar, 1982).
The objectives of PEM-Tropics
B extend beyond those of PEM-Tropics A to include focused
studies of (1) fast photochemical processes involving
the HOX radical family (HOX = OH
+ H + peroxy radicals), (2) the cause of the large-scale
ozone minimum over the western equatorial Pacific, (3)
vertical transport by deep convection in the SPCZ and
ITCZ, (4) the scavenging of gases and aerosols associated
with deep convection and gas to aerosol conversion in
convective outflow, and (5) the processes controlling
photochemistry and aerosol formation beneath the trade
wind inversion.
In PEM-Tropics B, OH and HO2 measurements
will be made aboard both the P-3B and the DC-8 aircraft,
enabling not only a repeat of the crucial boundary layer
tests of the basic photochemical model of OH formation
and loss but also measurements of OH in the upper free
troposphere. Recent studies (Jaegle et al., 1997;
McKeen et al., 1997, Prather and Jacob, 1997;
Wennberg et al., 1998) have pointed out that photolysis
of acetone, peroxides, and formaldehyde transported up
from the lower troposphere must be invoked to explain
observed OH levels. PEM-Tropics B will allow a close
examination of this hypothesis, because it will measure
the suspected precursors, along with OH and other atmospheric
constituents that play a major role in OH chemistry.
9. Challenges and Plans for
the Future
Considerable progress has
been made in the development of aircraft instrumentation
over the past two decades, but much more needs to be
done. A top priority is the development of an ensemble
of reliable, sensitive, and fast instruments for the
full suite of major nitrogen species (Crosley, 1996).
Further work is needed to improve the capabilities of
OH and peroxy radical measurements, and an intercomparison
mission for these species should be conducted in the
future. Other important gas phase species for which current
aircraft instrumentation is inadequate include NH3, CSO 2,
and other carbonyl compounds. Improved instrumentation
for measuring the microphysical and chemical properties
of aerosols is also needed. Chemical flux measurement
capabilities by eddy correlation are presently limited
to a handful of species (CO2, CH4,
O3, CO) and should be extended to others.
There are two missions under
consideration for 2001, the next opportunity for a large-scale
experiment. Both deal with the broad questions of the
impact of important source regions on the global atmosphere.
One of the two candidate missions
to follow PEM-Tropics B is TRACE-B (TRAnsport and Chemistry
near the Equator--Brazil). Plans for this mission have
been developed in two GTE workshops and a white paper
is available (Jacob et al., 1995). The goal of
TRACE-B would be to understand the contribution of Amazonia
to the global atmospheric budgets of greenhouse gases,
aerosols, and oxidants, and to determine the related
implications of rapid development and exploitation of
natural resources in the region. It would be conducted
as part of the Large-Scale Biosphere-Atmosphere Experiment
in Amazonia (LBA), an ongoing international program aimed
at improving knowledge of the regional moisture, energy,
biogeochemical, and trace gas budgets and their perturbation
by human activity. To minimize the influence of biomass
burning, a January-March time frame would be optimal
for TRACE-B. The data collected in TRACE-B, in combination
with the continuous ground-based biogeochemical measurements
conducted independently as part of LBA, would allow investigation
of spatial variations of trace gas fluxes along ecosystem
gradients, of atmospheric budgets of trace species over
the scale of the Amazon Basin, and of long range transport
across Basin boundaries.
The other candidate mission
is TRACE-P (TRAnsport
and Chemical Evolution over the Pacific). Plans for this
mission were developed at a recent GTE workshop and a white
paper is available (Jacob et al., 1998). The
goal of TRACE-P is to determine the chemical and physical
evolution of the outflow of natural and anthropogenic
gases and aerosols from the Asian continent to the western
Pacific. TRACE-P would respond to strong interest in
the scientific community to better understand the extent
of Asian influence on global atmospheric chemistry. Compared
to the two other major industrialized regions of the
world (North America and Europe), far less is known of
emissions from eastern Asia and of the chemistry of the
Asian outflow. The mix of anthropogenic and natural emissions
is expected to differ substantially from that in the
more developed countries of North America and Europe.
As a result, the chemical composition and evolution of
the continental outflow may be quite different. The anthropogenic
contribution is expected to increase sharply during the
next decade.
A decision between these two
candidate missions for the year 2001 will be made in
an ad hoc mission planning workshop to be held
late in 1998 or early in 1999.
Acknowledgments
The GTE results summarized
in this article are products of the work of many GTE
investigators, whose achievements we are pleased to recognize.
The GTE missions would not have been possible without
the dedicated work of the GTE project office personnel
at the Langley Research Center, especially James Hoell
and Richard Bendura.
We also wish to thank Martin
Schultz, for preparing Figures 3 and 9, Gao Chen for
preparing Figure 5, and James Hoell and Jean McNeal for
helpful comments on the manuscript.
References
- Andreae, M.O., R. Ferek,
F. Bermond, K. Byrd, R. Engstrom, S. Hardin, P. Houmere,
F. LeMarrec, H. Raemdonck, and R. Chatfield, Dimethyl
sulfide in the marine atmosphere, J. Geophys. Res., 90,
12,891-12,900, 1985.
- Bates, T.S., B.K. Lamb,
A. Guenther, J. Dignon, and R.E. Stoiber, Sulfur emissions
to the atmosphere from natural sources, J. Atmos.
Chem., 14, 315-336, 1992.
- Blake, D.R., T.-Y. Chen,
T.W. Smith Jr., C.J.-L. Wang, O.W. Wingenter, N.J.
Blake, F.S. Rowland, and E.W. Mayer, Three-dimensional
distribution of non-methane hydrocarbons and halocarbons
over the northwestern Pacific during the 1991 Pacific
Exploratory Mission (PEM-West A), J. Geophys. Res., 101,
1763-1778, 1996.
- Blake, N.J., D.R. Blake,
T.-Y. Chen, J.E. Collins Jr., G.W. Sachse, B.E. Anderson,
and F.S. Rowland, Distribution and seasonality of selected
hydrocarbons and halocarbons over the western Pacific
basin during PEM-West A and PEM-West B, J. Geophys.
Res., 102, 28,315-28,331, 1997.
- Bradshaw, J., D. Davis.
J. Crawford, G. Chen, R. Shetter, M. Muller, G. Gregory,
G. Sashse, J. Barrick, D. Blake, B. Heikes, and S.
Sandholm, Photostationary state analysis of the NO2-NO
System based on airborne observations during PEM-Tropics, J.
Geophys. Res., submitted, 1998.
- Browell, E.V., M.A. Fenn,
C.F. Butler, W.B. Grant, J.T. Merrill, R.E. Newell,
J.D. Bradshaw, S.T. Sandholm, B.E. Anderson, A.R. Bandy,
A.S. Bachmeier, D.R. Blake, D.D. Davis, G. L. Gregory,
B. G. Heikes, Y. Kondo, S.C. Liu, F.S. Rowland, G.W.
Sachse, H.B. Singh, R.W. Talbot, and D.C. Thornton,
Large-Scale air mass characteristics observed over
the western Pacific during the summertime, J. Geophys.
Res., 101, 1691-1912, 1996.
- Charlson, R.J., Lovelock,
J.E., Andreae, M.O., and Warren, S.G., Oceanic phytoplankton,
atmospheric sulfur, cloud albedo, and climate, Nature, 326,
655-661, 1987.
- Clarke, A.D., Atmospheric
nuclei in the Pacific mid-troposphere: Their nature,
concentration, and evolution, J. Geophys. Res., 98,
20633-20647, 1993.
- Clarke, A.D., D. Davis,
V. Kasputin, F. Eisele, G. Chen, I. Paluch, D. Lenschow,
A. Bandy, D. Thornton, K. Moore, L. Mauldin, R. Tanner,
M. Carroll, G. Abercook, J. Collins, and M. Litchy,
Particle nucleation in the tropical boundary layer:
A case study involving marine sulfur sources, Science,
submitted, 1998.
- Crawford, J., D. Davis,
G. Chen, J. Bradshaw, S.Sandholm, G. Gregory, G. Sachse,
B. Anderson, J. Collins, D. Blake, H. Singh, B. Heikes,
R. Talbot, and J. Rodriquez, Photostationary state
analysis of the NO2-NO system based on airborne
observations from the western and central North Pacific, J.
Geophys. Res., 101, 2053-2072, 1996.
- Crawford, J.H., D. Davis,
G. Chen, J. Bradshaw, S. Sandholm, Y. Kondo, S. Liu,
E. Browell, G. Gregory, B. Anderson, G. Sachse, J.
Collins, J. Barrick, D. Blake, R. Talbot, and H. Singh,
An assessment of ozone photochemistry in the extratropical
western north Pacific: Impact of continental outflow
during the late winter/early spring, J. Geophys.
Res., 102, 28,469-28,488, 1997a.
- Crawford, J.H., D.D. Davis,
G. Chen, J. Bradshaw, S. Sandholm, Y. Kondo, J. Merrill,
S. Lou, E. Browell, G. Gregory, B. Anderson, G. Sachse,
J. Barrick, D. Blake, R. Talbot, and R. Pueschel, Implications
of large scale shifts in tropospheric NOX levels
in the remote tropical Pacific, J. Geophys. Res., 102,
28,447-28,468, 1997b.
- Crosley, D.R., The measurement
of OH and HO2 in the troposphere, J.
Atmos. Sci., 52, 3299-3314, 1995.
- Crosley, D.R., NOY blue
ribbon panel, J. Geophys. Res., 100,
2049-2052, 1996.
- Crutzen, P.J., and M.O.
Andreae, Biomass burning in the tropics: Impact on
atmospheric chemistry and biogeochemical cycles, Science, 250,
1669-1678, 1990.
- Davis, D., J. Crawford,
G. Chen, W. Chameides, S. Liu, J. Bradshaw, S. Sandholm,
G. Sachse, G. Gregory, B. Anderson, J. Barrick, A.
Bachmeir, J. Collins, E. Browell, D. Blake, S. Rowland,
D. Blake, Y. Kondo, H. Singh, R. Talbot, B. Heikes,
J. Merrill, J. Rodriguez, and R. Newell, Assessment
of the ozone photochemistry tendency in the western
North Pacific as inferred from PEM-West A observations
during the fall of 1991, J. Geophys. Res., 101,
2111-2134, 1996.
- Davis D.D., G. Chen, A.
Bandy, D. Thornton, F. Eisele, L. Mauldin, D. Tanner,
D. Lenschow, B. Huebert, J. Heath, A. Clarke, and D.
Blake, DMS oxidation in the equatorial Pacific: Comparison
of model simulations with field observations for DMS,
SO2, H2SO4(g), MSA(g),
MS, and NSS, J. Geophys. Res., in press, 1998.
- Eisele, F.L., and D.J.
Tanner, Ion-assisted tropospheric OH measurements, J.
Geophys. Res., 96, 9295-9308, 1991.
- Fishman, J., C.E. Watson,
J.C. Larsen, and J.A. Logan, Distribution of tropospheric
ozone determined from satellite data, J. Geophys.
Res., 95, 3599-3618, 1990.
- Fishman, J., J.M. Hoell,
Jr., R.J. Bendura, R.J. McNeal, and V.W.J.H. Kirchhoff,
NASA GTE TRACE-A experiment (September-October, 1992):
Overview. J. Geophys. Res., 101, 23,865-23,880,
1996.
- Fuelberg, H.E., R.E. Newell,
S. Longmore, Y. Zhu, and D.J. Westberg, and E.V. Browell.
A meteorological overview of the PEM-Tropics experiment,
submitted to J. Geophys. Res., 1998.
- Gregory, G.L., A.S. Bachmeier,
D.R. Blake, B.G. Heikes, D.C. Thornton, A.R. Bandy,
J.D. Bradshaw, and Y. Kondo, Chemical signatures of
aged Pacific marine air: Mixed layer and free troposphere
as measured during PEM-West A, J. Geophys. Res., 101,
1727-1742, 1996.
- Gregory, G.L., D.J. Westberg,
M. C. Shipham, D.R. Blake, R.E. Newell, R.W. Talbot,
B.G. Heikes, G.W. Sachse, B.A. Anderson, and D.C. Thornton.
Chemical characteristics of Pacific tropospheric air
in the region of the ITCZ and SPCZ, submitted to J.
Geophys. Res., 1998.
- Jacob, D.J., S.C. Wofsy,
P.S. Bakwin, S.-M. Fan, R.C. Harriss, R.W. Talbot,
J. Bradshaw, S. Sandholm, H.B. Singh, G.L. Gregory,
E.V. Browell, G.W. Sachse, D.R. Blake, and D.R. Fitzjarrald,
Summertime photochemistry at high northern latitudes, J.
Geophys. Res., 97, 16,421-16,431, 1992.
- Jacob, D.J., et al.,
TRAnsport and Chemistry near the Equator--Brazil (TRACE-B)
(white paper), 1995. See the GTE home page at http://www-gte.larc.nasa.gov
for a copy of this document.
- Jacob, D.J., B.G. Heikes,
S.-M. Fan, J.A. Logan, D.L. Mauzerall, J.D. Bradshaw,
H.B. Singh, G.L. Gregory, R.W. Talbot, D.R. Blake,
and G.W. Sachse, Origin of ozone and NOX in
the tropical troposphere: A photochemical analysis
of aircraft observations over the South Atlantic Basin, J.
Geophys. Res., 101, 24,235-24,350, 1996.
- Jacob, D.J., et al.,
TRansport and Chemical Evolution over the Pacific (TRACE--P):
An aircraft mission for GTE (white paper), 1998. See
the GTE home page at http://www-gte.larc.nasa.gov for
a copy of this document.
- Jaegle, L., D.J. Jacob,
P.O. Wennberg, C.M. Spivakovsky, T.F. Hanisco, E.L.
Lanzendorf, E.J. Hintsa, D.W. Fahey, E.R. Keim, M.H.
Proffitt, E. Atlas, F. Flocke, S. Schauffler, C.T.
McElroy, C. Midwinter, L. Pfister, and J.C. Wilson,
Observed OH and HO2 in the upper troposphere
suggest a major source from convective injection of
peroxides, Geophys. Res. Lett., 24, 3181-3184,
1997.
- Kawakami, K., Y. Kondo,
M. Koike, H. Nakajima, G.L. Gregory, G.W. Sachse, R.E.
Newell, E.V. Browell, D.R. Blake, J.M. Rodriguez, and
J.T. Merrill, Impact of lightning and convection on
reactive nitrogen in the tropical free troposphere, J.
Geophys. Res., 102, 28,367-28,384, 1997.
- Kirchhoff, V.W.J.H., R.A.
Barnes, and A.L. Torres, Ozone climatology at Natal,
Brazil, from in situ ozonesonde data J. Geophys.
Res., 96, 10,899-10,909, 1991.
- Liu, S.C., S.A. McKeen,
E.-Y. Hsie, X. Lin, K.K. Kelly, J.D. Bradshaw, S.T.
Sandholm, E.V. Browell, G.L. Gregory, G.W. Sachse,
A.R. Bandy, D.C. Thornton, D.R. Blake, F.S. Rowland,
R.E. Newell, B.G. Heikes, H. Singh, and R.W. Talbot.,
A model study of tropospheric trace species during
PEM-West A: Continental vs. marine, J. Geophys.
Res., 101, 2073-2086, 1996.
- Logan, J.A., Prather, M.J.,
Wofsy, S.C. and McElroy, M.B., Tropospheric Chemistry:
A global perspective. J. Geophys. Res.,86,
7210-7254, 1981.
- Logan, J.A. and V.W.J.H.
Kirchhoff, Seasonal variations of tropospheric ozone
at Natal, Brazil, J. Geophys. Res., 91,
7875-7881, 1986.
- Mahlman, J.D., H. Levy
II, and W.J. Moxim, Three-dimensional tracer structure
and behavior as simulated in two ozone precursor experiments, J.
Atmos. Sci., 37, 655-685, 1980.
- Mauldin, R.L. III, D.J.
Tanner, and F.L. Eisele, Measurements of OH During
PEM-Tropics, J. Geophys. Res., in press, 1998a.
- Mauldin, L., D. Tanner,
J. Heath, B. Huebert, and F. Eisele, Observations of
H2SO4 and MSA during PEM-Tropics
A, J. Geophys. Res., in press, 1998b.
- McKeen, S.A., S. C. Liu,
E.-Y. Hsie, X. Lin, J.D. Bradshaw, S. Smyth, G.L. Gregory,
and D.R. Blake, Hydrocarbon ratios during PEM-West
A: A model perspective, J. Geophys. Res., 101,
2087-2110, 1996.
- McKeen, S.A., T. Gierczak,
J.B. Burkholder, P.O. Wennberg, T.F. Hanisco, E.R.
Keim, R.-S. Gao, S.C. Liu, A.R. Ravishankara, and D.W.
Fahey, The photochemistry of acetone in the upper troposphere:
A source of odd-hydrogen radicals, Geophys. Res.
Lett., 24, 3177-3180, 1997.
- Merrill, J.T., R. Bleck,
and L. Avila, Modeling atmospheric transport to the
Marshall Islands, J. Geophys. Res., 90,
12,297-12,936, 1985.
- Merrill, J.T., Atmospheric
long range transport to the Pacific Ocean, in: Chemical
Oceanography, 10, edited by J. P.
Riley and R. Duce, 15-50, London, Academic Press, 1989.
- Merrill, J.T., R.E. Newell,
and A.S. Bachmeier, A meteorological overview for the
Pacific Exploratory Mission-West Phase B, J. Geophys.
Res., 102, 28,241-28,253, 1997.
- Mount G.H., F.L. Eisele,
D.J. Tanner, J.W. Brault, P.V. Johnson, J.W. Harder,
E.J. Williams, A. Fried, and R.Shetter, An intercomparison
of spectroscopic laser long-path and ion-assisted in
situ measurement of hydroxyl concentrations during
the tropospheric OH photochemistry experiment, fall
1993, J. Geophys. Res., 102, 6437-6456,
1997.
- NAS, Global Tropospheric
Chemistry Report, National Research Council, National
Academy of Sciences, National Academy Press, Washington,
DC, 1984.
- Newell, R.E., E.V. Browell,
D.D. Davis, and S.C. Liu, Correspondence between tropospheric
ozone and potential vorticity in the western Pacific, Geophys.
Res. Lett., 24, 2733-2736, 1997.
- Olson, J.R., J. Fishman,
V.W.J.H. Kirchhoff, D. Nganga, and B. Cros, Analysis
of the distribution of ozone over the southern Atlantic
region, J. Geophys. Res., 101, 24,083-34,094,
1996.
- Oltmans, S.J., and W.D.
Khomyr, Surface ozone distributions and variations
from 1973-1984 measurements at the NOAA Geophysical
Monitoring for Climatic Change baseline observatories, J.
Geophys. Res., 91, 5229-5236, 1986.
- Piotrowicz, S.R., H.F.
Bezdek, G.R. Harvey, M. Springer-Young, and K.J. Hanson,
On the ozone minimum over the equatorial Pacific Ocean, J.
Geophys. Res., 96, 18,679-18,687, 1991.
- Prather, M.J., and D.J.
Jacob, A persistent imbalance in HOX and
NOX photochemistry in the upper troposphere
driven by deep tropical convection, Geophys. Res.
Lett., 24, 3189, 1997.
- Reichle, H.G., Jr., V.S.
Connors, J.A. Holland, R.T. Sherrill, H.A. Wallio,
J. C. Casas, E.P. Condon, B.B. Gormsen, and W. Seiler,
The distribution of middle tropospheric carbon moNOXide
during early October 1984, J. Geophys. Res., 95,
9845-9856, 1990.
- Routhier, F., K. Dennett,
D.D. Davis, A. Wartburg, P. Haagenson, and A.C. Delany,
Free tropospheric and boundary-layer airborne measurements
of ozone over the latitude range of 58S to 70N, J.
Geophys. Res., 85, 7307-7321, 1980.
- Schultz, M., D.J. Jacob,
J.A. Logan, Y. Wang, D. Blake, J. Bradshaw, G. Gregory,
G. Sachse, R. Shetter, H. Singh, and R. Talbot, On
the origin of tropospheric ozone and NOX over
the tropical Pacific, submitted to J. Geophys. Res.,
1998.
- Sandholm, S., S. Smyth,
R. Bai, and J. Bradshaw, Recent and future improvements
in two-photon laser-induced fluorescence NO measurement, J.
Geophys. Res., 102, 28,651-28,662, 1997.
- Singh, H., D. Herlth, R.
Kolyer, L. Salas, J.D. Bradshaw, S.T. Sandholm, D.D.
Davis, J. Crawford, Y. Kondo, M. Koike, R. Talbot,
G.L. Gregory, G.W. Sachse, E. Browell, D.R. Blake,
F.S. Rowland, R. Newell, J. Merrill, B. Heikes, S.
C. Liu, P.J. Crutzen, M. Kanakidou., Reactive nitrogen
and ozone over the western Pacific: Distribution, partitioning
and sources, J. Geophys. Res., 101, 1793-1808,
1996.
- Smyth, S., J. Bradshaw,
S. Sandholm, S. Liu, S. McKeen, G. Gregory, B. Anderson,
R. Talbot, D. Blake, F.S. Rowland, E. Browell, M. Fenn,
J. Merrill, S. Bachmeier, G. Sachse, J. Collins, D.
Thornton, D. Davis, and H. Singh, Comparison of free
tropospheric western Pacific air mass classification
schemes for the PEM-West A experiment, J. Geophys.
Res., 101, 1743-1762, 1996.
- Talbot, R.W. J.E. Dibb,
K.I. Klemm, J.D. Bradshaw, S.T. Sandholm, D.R. Blake,
G.W. Sachse, J. Collins, B.G. Heikes, G.L. Gregory,
B.E. Anderson, H.B. Singh, D.C. Thornton, and J. T.
Merrill, Chemical characteristics of continental outflow
from Asia to the troposphere over the western Pacific
Ocean during September-October 1991: Results from PEM-West
A, J. Geophys. Res., 101, 1713-1725,
1996.
- Talbot, R.W. J.E. Dibb,
B.L. Lefer, J.D. Bradshaw, S.T. Sandholm, D.R. Blake,
N.J. Blake, G.W. Sachse, J.E. Collins Jr., B.G. Heikes,
J.T. Merrill, G.L. Gregory, B.E. Anderson, H.B. Singh,
D.C. Thornton, A.R. Bandy, and R.F. Pueschel, Chemical
characteristics of continental outflow from Asia to
the troposphere over the western Pacific Ocean during
February - March 1994: Results from PEM-West B, J.
Geophys. Res., 102, 28255-28274, 1997.
- Talbot, R.W., J.E. Dibb,
E.M. Scheuer, D.R. Blake, N.J. Blake, G.L. Gregory,
G.W. Sachse, J.D. Bradshaw, S.T.Sandholm, and H.B.
Singh, Influence of biomass combustion emissions on
the distribution of acidic trace gases over the southern
Pacific basin during austral springtime, submitted
to J. Geophys. Res., 1998.
- Thompson, A.M., K.E. Pickering,
D.P. McNamara, M.R. Schoeberl, R.D. Hudson, J.H. Kim,
E.V. Browell, V.W.J.H. Kirchhoff, and D. Nganga, Ozone
over southern Africa during SAFARI-92/TRACE A, J.
Geophys. Res., 101, 23,793-23,807, 1996.
- Thornton, D.C. A.R. Bandy,
B.W. Blomquist, D.D. Davis, and R.W. Talbot, Sulfur
dioxide as a source of condensation nuclei in the upper
troposphere of the Pacific Ocean, J. Geophys. Res., 101,
1883-1890, 1996.
- Thornton, D.C., A.R. Bandy,
B.W. Blomquist, R.W. Talbot, and J.E. Dibb, Transport
of sulfur dioxide from the Asian Pacific Rim to the
North Pacific troposphere, J. Geophysical Res., 102,
28,489-28,499, 1997.
- Thornton, D. C. , A. Bandy,
A. Driedger, B. Bloomquist, and T. Wade, Sulfur dioxide
distributions over the Pacific Ocean 1991-1996, J.
Geophys. Res., in press, 1998.
- Turman, B.N., and B.C.
Edgar, Global lightning distributions at dawn and dusk, J.
Geophys. Res., 87, 1191-1206, 1982.
- Wang, Y, J.A. Logan, and
D.L. Jacob, Global simulation of tropospheric O3-NOX-hydrocarbon
chemistry: 2. Model evaluation and global ozone budget, J.
Geophys. Res., in press, 1998.
- Wennberg, P., T. Hanisco,
L. Jaegle, D. Jacob, E. Hintsa, S. Donnelly, L. Del
Negro, D. Fahey, S. McKeen, R. Salawitch, C. Webster,
R. May, R. Herman, M. Proffitt, J. Margitan, E. Atlas,
S. Schauffler, F. Flocke, C.T. Mcroy, and T. Bui, Science, 279,
49-53, 1998.
|
|